Turn your Data into Insight
Dashboards
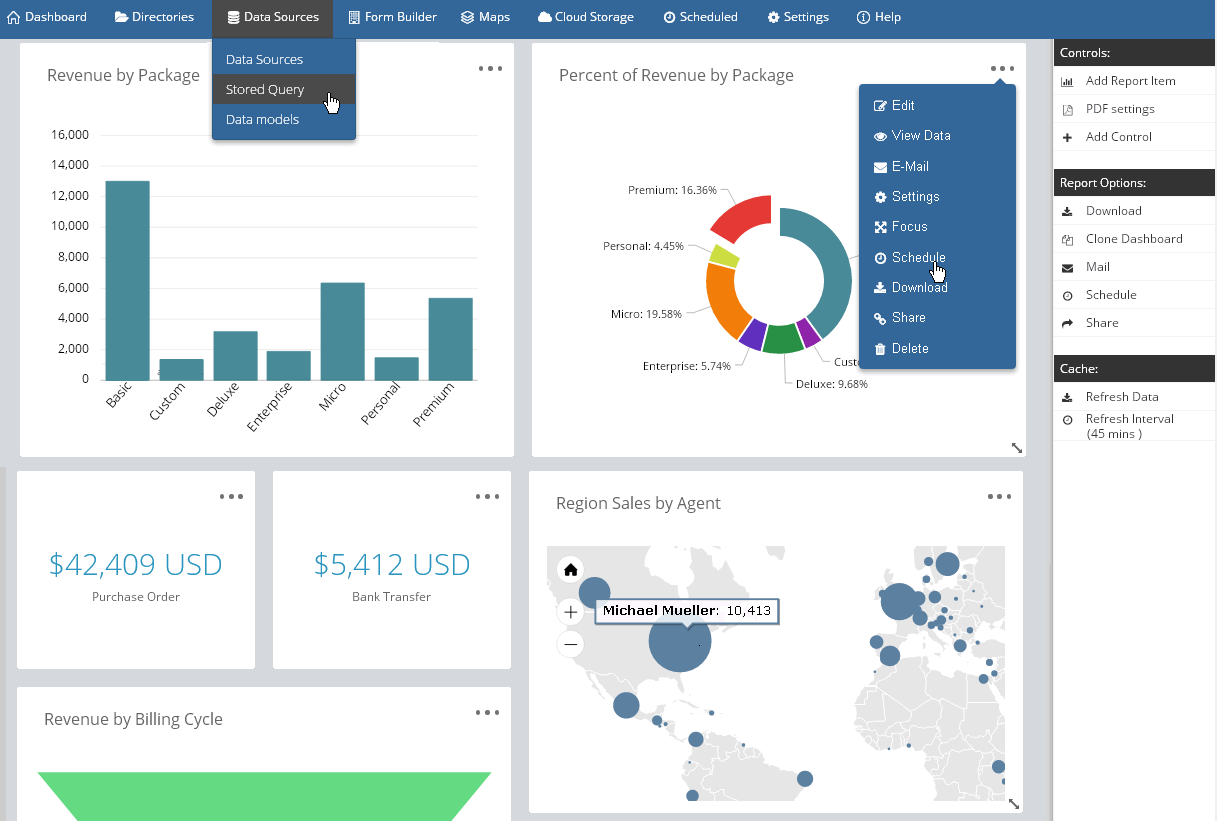

Create comprehensive visulizations and engage your team members and clients. Dashoard components can be exported and shared individually or as a whole.
Add unlimited reports, charts, maps to your dashboard to present the information you want the way you want it. Drag-and-drop grid layout makes customizing easy
- Reports, Charts, and Maps
- Drag-and-drop Grid
- PDF, Schdedule and Email Dashboards
- Local and Global Filters
Dashboards also offer Global Filtering, allowing end users to select filters and have them apply to all dashboard elements. Dashboard elements can still be filtered individually as well, offering you the ultimate flexibility.
Reports
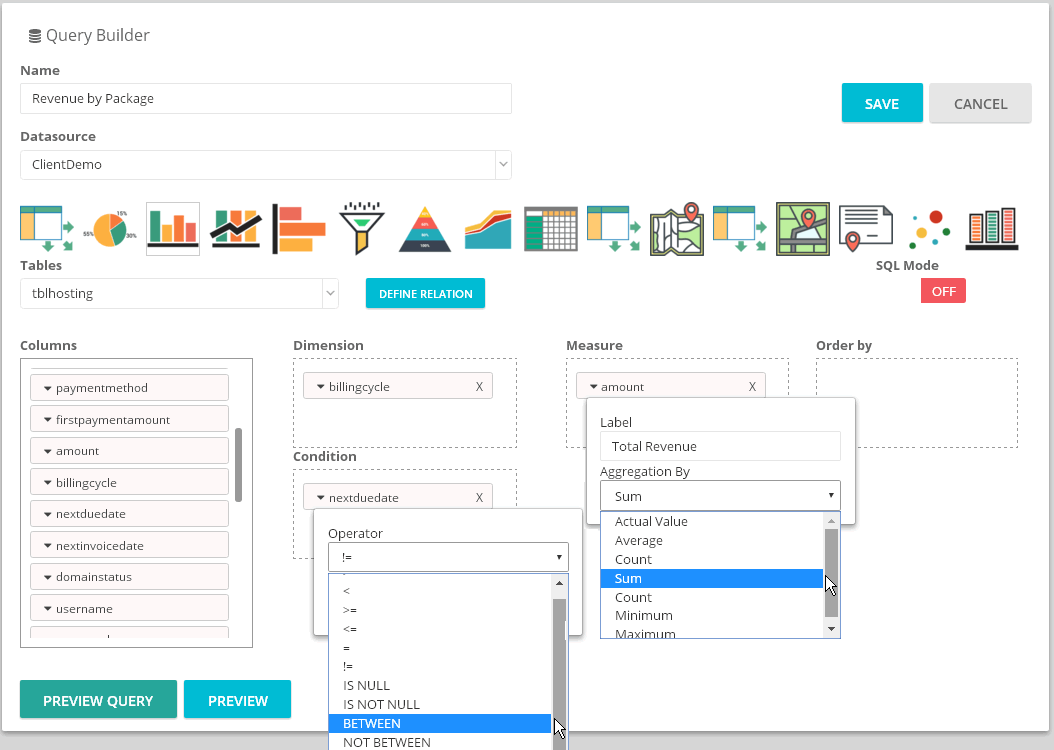

Reports include Table Reports, Summary Reports, Pivot Tables, and Single Value Reports.
Reports can be built using drop-and-drag or via SQL. Joins can also be made via SQL or via the "Relation Builder" GUI. Dynamic filters can be added by simply clicking on the appropriate SQL tag and selecting the columns or data to filter on. You can as many filters to reports as you wish to.
Reports can be exported as PDF, CSV, or shared via secure link. You can also schedule and email reports.
Charts
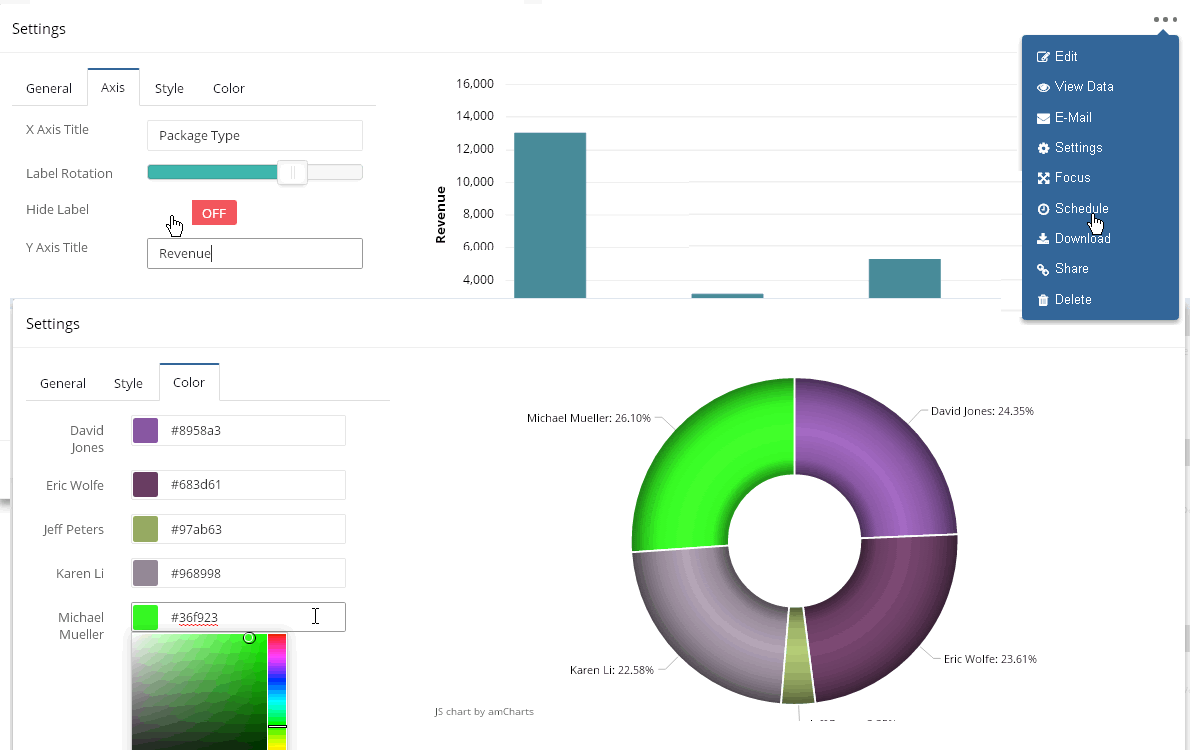

PlexBI includes 15 chart styles, with the option to add additional types. Chart types include Pie Charts, Bar Charts, Line Charts, Area Charts, and Pyramid, Funnel and others.
The Chart settings tab allows you to customize virtually every aspect of your charts; type, color, labels, axis tilt, legends, labels, and other options.
Maps
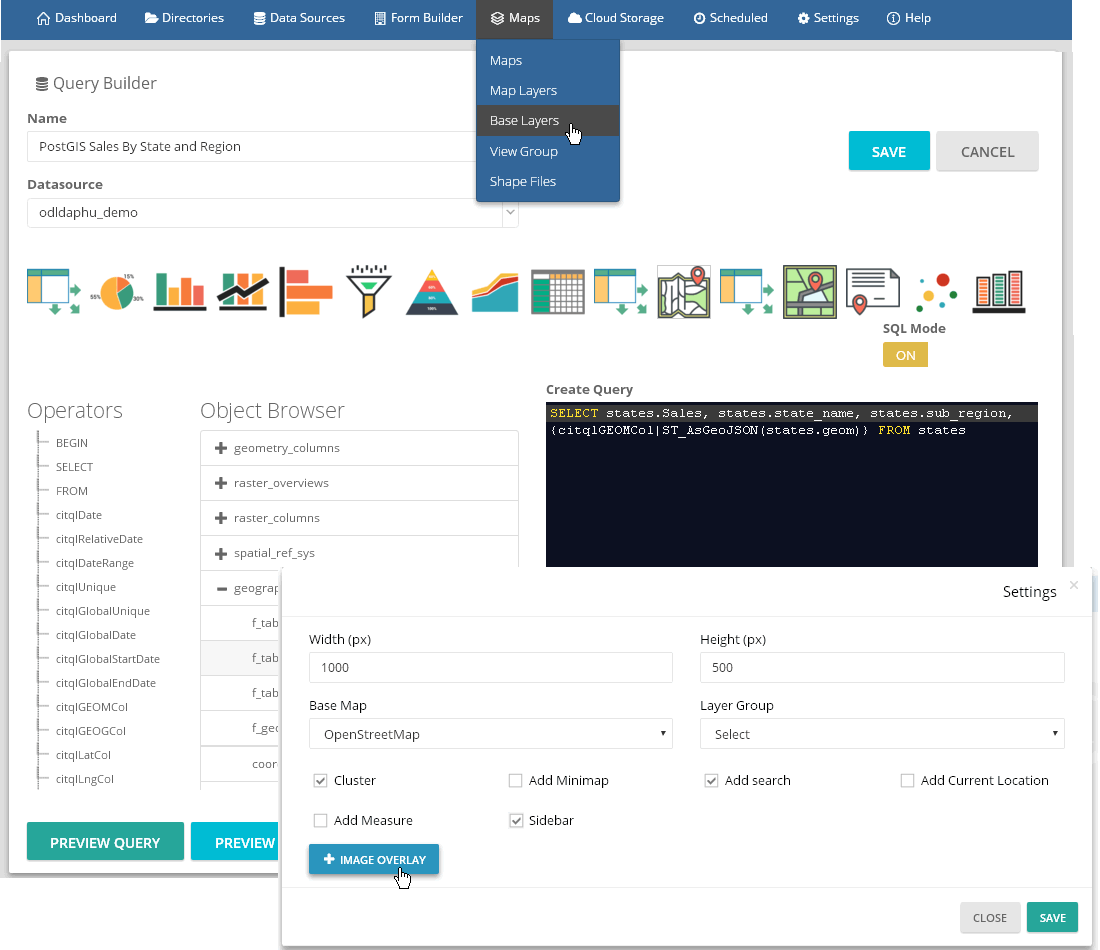

PlexBI provides full support for PostGIS, allowing you to turn your data into meaningful, interactive maps quickly and easily.
In addition to PostGIS, maps can be created via SQL or drop-and-drag UI from any data source containing location data.
PlexBI also allows users to create re-usable layers to add to maps. Additionally, "free-hand" maps can also be created.
While PlexBI SQL Maps work with any map provider (Google, MapBox, OSM, BING, etc..), users also have access to MapFig base maps.
Forms
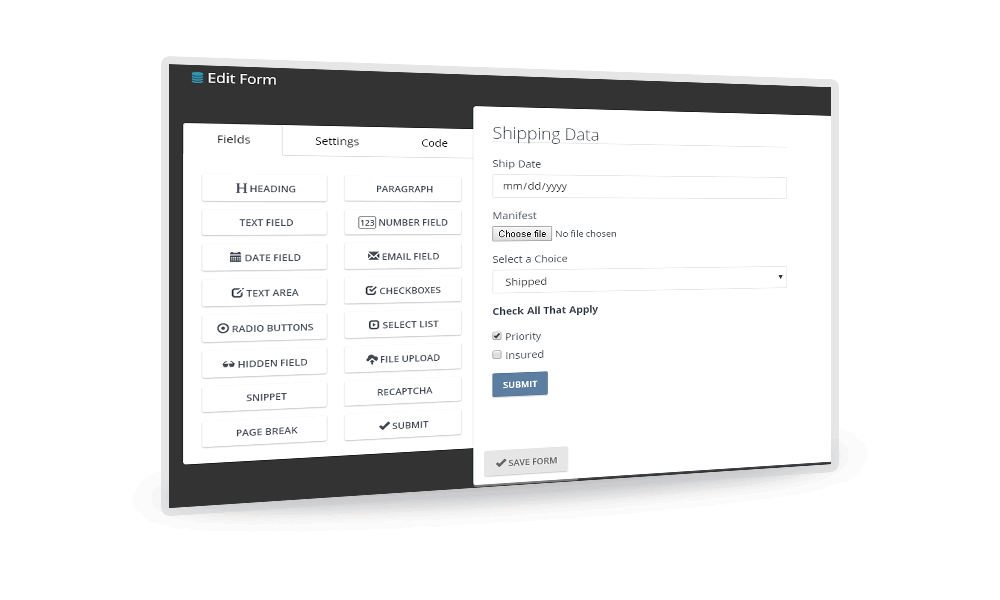

PlexBI allows to easily create, edit, and deploy professional forms to any platform.
Our drag-and-drop interface allows you to create forms of any type and store data in your database(s) as well as CSV.
Forms can be deployed with or without password protection as well as behind firewalls.


