Single Value Reports
Single Value Reports, also known as a “Number or Totals Report”, are used for visualizing an overall metric, such as “Total Expenses for Year”, “Total Orders”, “Total Product Revisions”, etc….
There are two method for creating Single Value Reports.
1. Drag and drop Mode
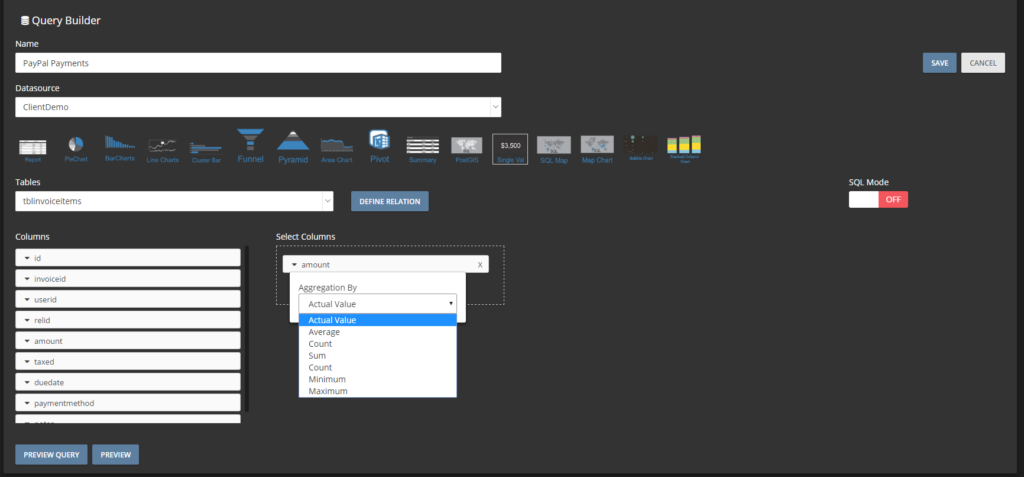
Just drop column and select appropriate Aggregate function and click Preview button it will show preview of this report.
2. SQL Mode
This mode will enable you to create an SQL Query. While the Query can be as complex as you need it to be, the return value must by only one column.
Example Query:
SELECT sum(AMOUNT) FROM PRODUCT
Query with Where Clause and Group By:
SELECT sum(amount) FROM invoice where year(created_date) = 2016 group by year(created_at)
Once you write your query, hit preview button and it will display the report output.
Finally, click on the Save button. The report will then appear on your Dashboard screen.
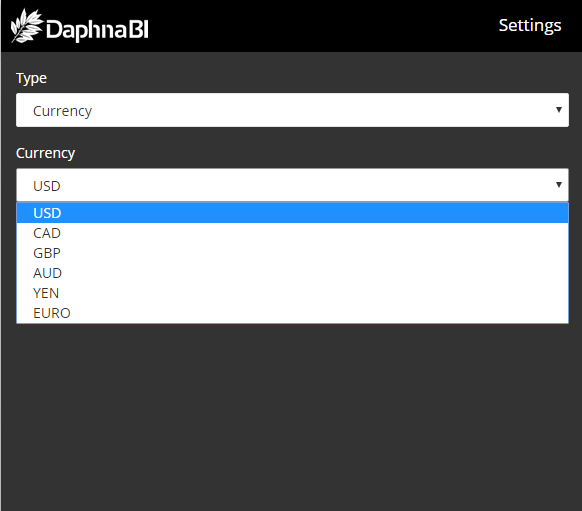
Settings
On the top right corner of the report element, click on the dots (…)->click on Settings
Here you can format your data.