Create a Map from PostGIS
Create an SQL Map from PostGIS
This section will cover creating an SQL map from PostGIS using our SQL Map application.
This section assumes you have loaded the states_basic21.zip file via our shp2pgsql GUI (or via command line or desktop).
If you have not done so, please see: Loading SHP Files
This section will cover making your first map from start to finish. In subsequent sections, we will show various features and functionality you can add to your SQL Maps.
Step 1: Log into the SQL Map interface
Log into the mapfig SQL interface using the credentials emailed to you.
Step 2: Create a Data Source
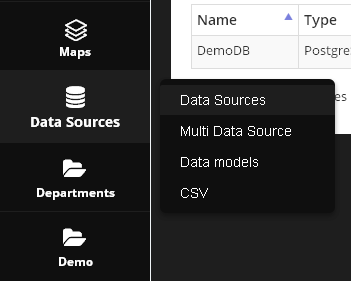
On the left menu click Data Source > Add Data Source
Enter the connection information for the PostGIS database where you loaded the shp file as shown below. Note that you can also connect to Oracle, MySQL, and SQL Server as well as PostgreSQL
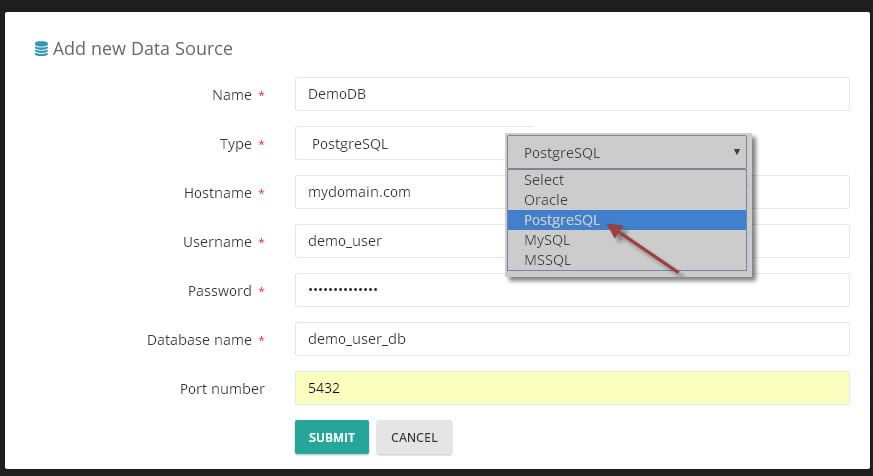
Click the Submit Button
Step 3: Create a Department
Departments are the top-level directory for your report folders. You can create an unlimited number of Directories and each can contain unlimited folders.
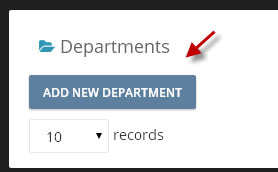
On the left menu, click on Departments and then click on “Add New Department” as shown below. For Department name, we’ll use ‘Demo’, but you can use whatever you wish to.
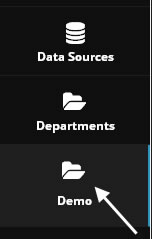
You should now see your new Directory on the left hand menu as below:
Step 4: Create a Folder
Folders allow you to keep your work organized and easily accessible. Additionally, in the next phase of our rollout, you will be able to add End Users and assign granular level access on both folders and reports.
Click on the Demo Directory you created in step 2 above.
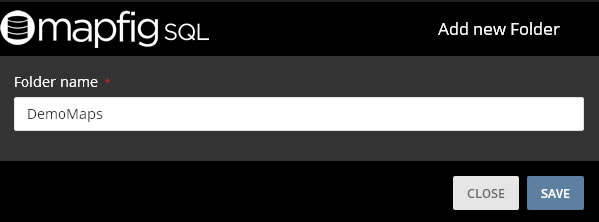
In the “Add New Folder” modal, enter the name you wish to use. We will be using “DemoMaps”
Step 5: Create Report
On the folder you created, click the “Generate Reports” button as shown below.
![]()
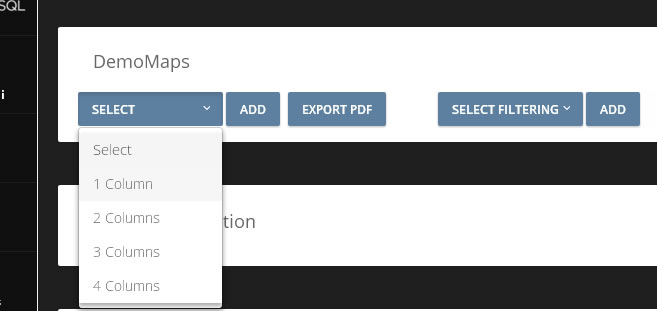
Use the Layout Selector drop down and select ‘1 Column’ as shown below.
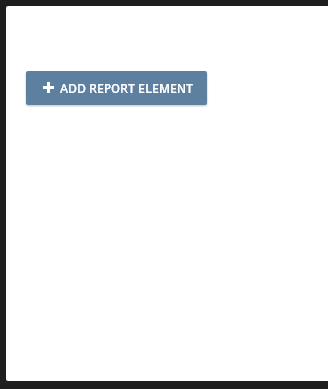
A one column element will be added as shown below.
Click on the “Add Report Element” button:
This will start the Create ReportWizard.
Step 6: Create Report Wizard
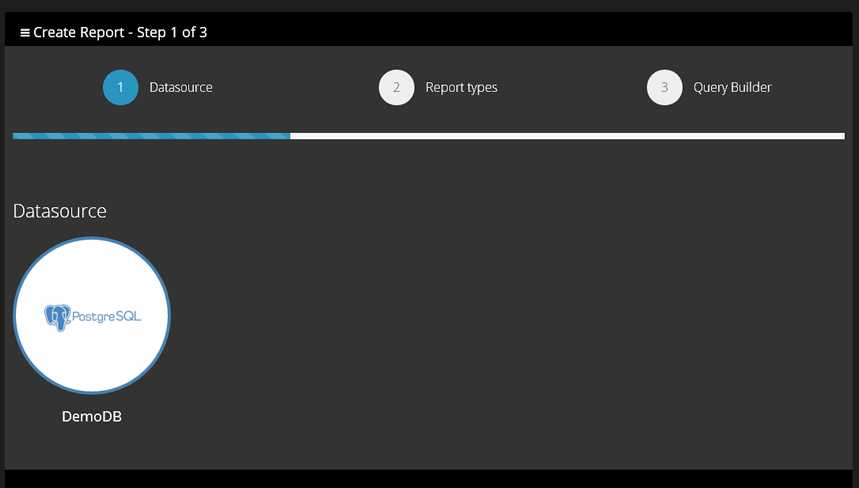
Step 1 of 3: For Data Source, select the Data Source you added in step 2 above as shown below:
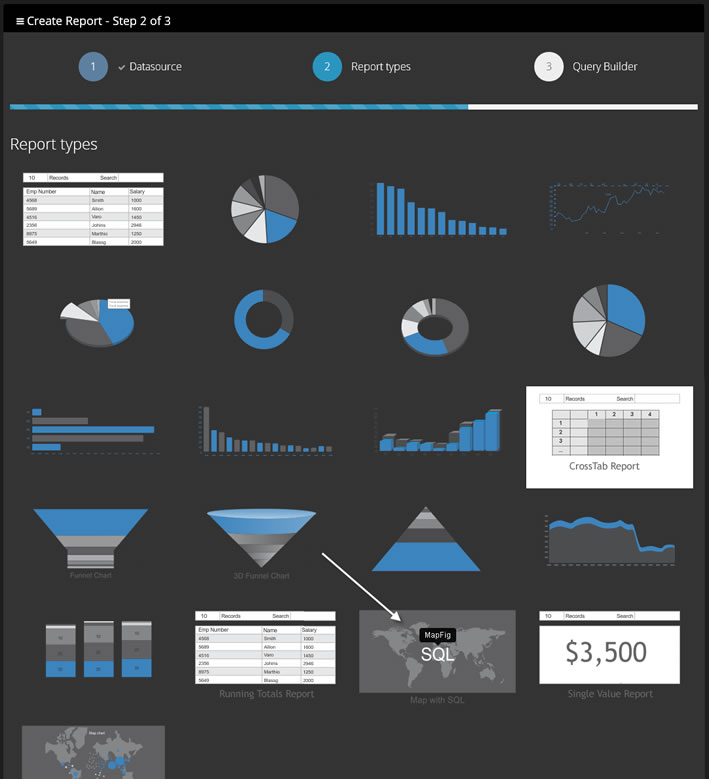
Step 2 of 3: For Report Type, select SQL Map as shown below:
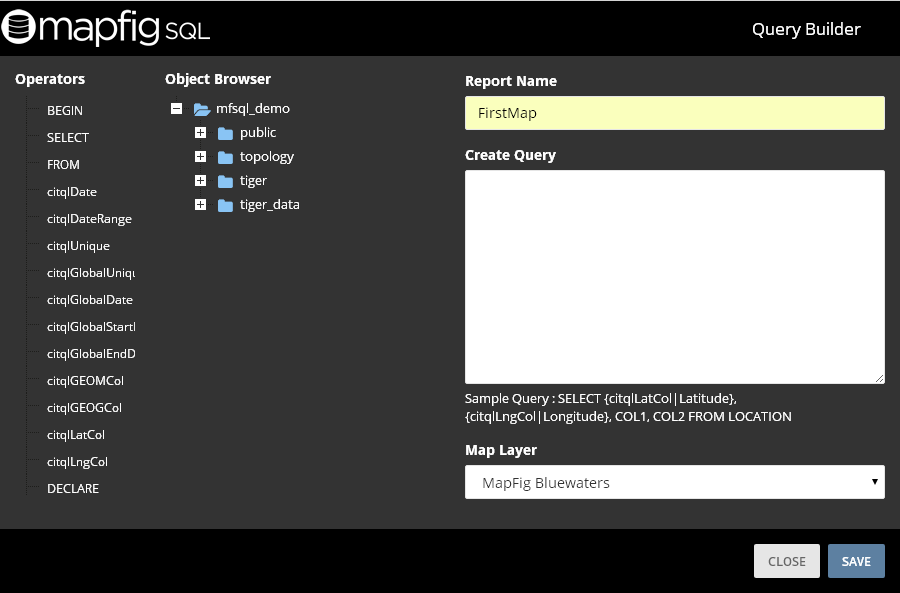
Step 3 of 3: The Query Builder
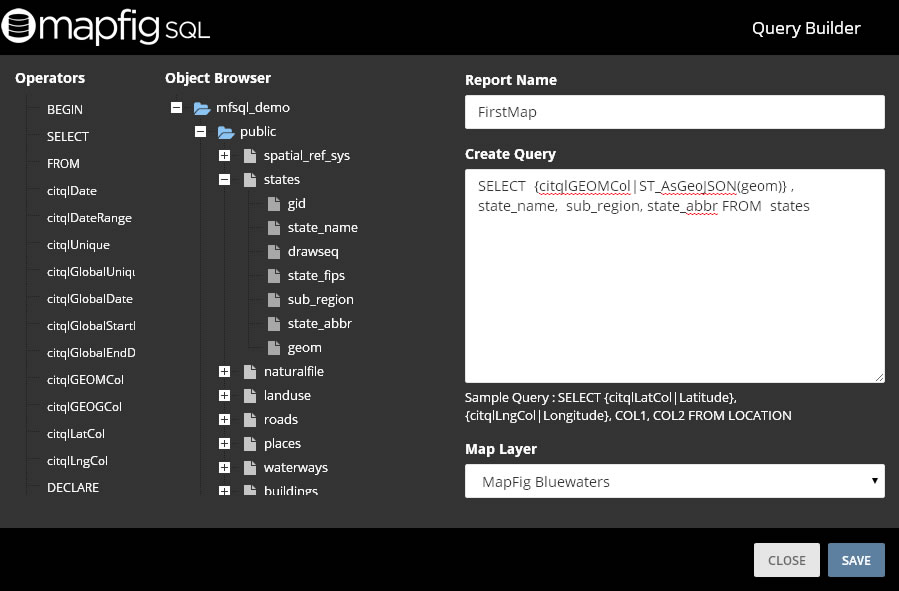
In the Query Builder, give your map a name. We’ll call our Report “FirstMap”
Step 7: PostGIS SQL
In the Query Pane, you can use the Operator and Object Browser to click-in all names or simply type in your SQL.
In the Operators column, click “Select” and then click “citqlGEOMCol”, which will produce “SELECT {citqlGEOMCol|ST_AsGeoJSON(columnName)}” as shown below in the Query Pane:
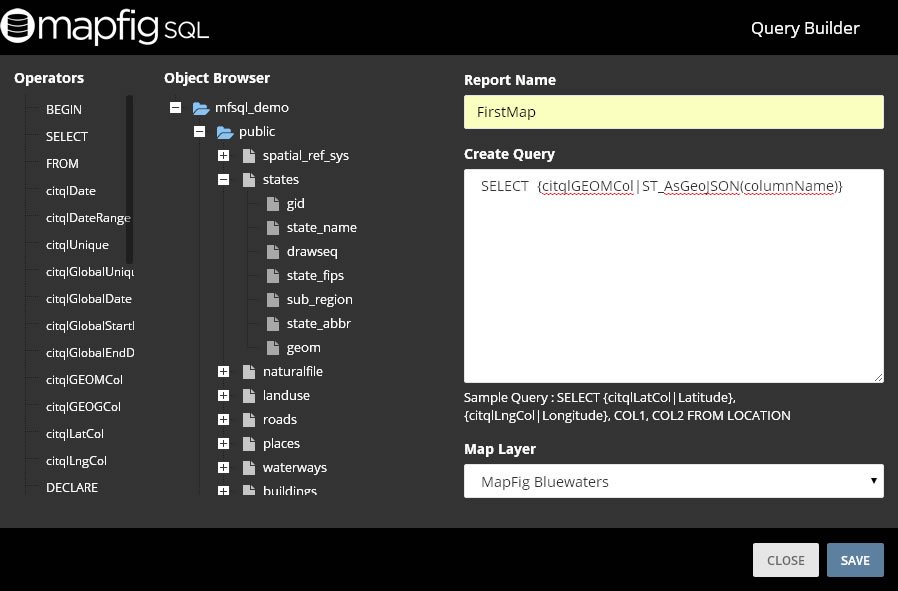
The citql tag may look a bit awkward, but it is actually designed to transparent.
{citqlGEOMCol|ST_AsGeoJSON(columnName)} is simply using the PostGIS ST_AsGeoJSON function to pass our geom column data to the Query Builder as a JSON object.
We selected the citqlGEOM tag as our data type is GEOM, if our data type was GEOG, we would have selected citqlGEOGCol, etc…
All we need to do is to click-in (or type in) the column name for our GEOM column, replacing ‘ColumnName’ with the name of our GEOM column.
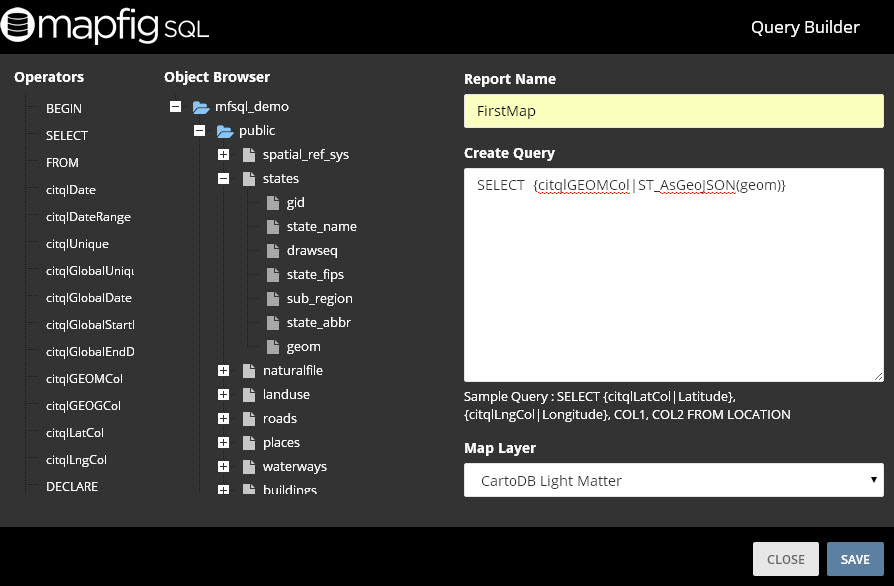
In this case, the name of our GEOM column is ‘geom’, so it will be:
SELECT {citqlGEOMCol|ST_AsGeoJSON(geom)}
Step 8: Add additional columns to map
Click-in (or type in) the state_name, sub_region, state_abbr columns as shown below.
Finally, click-in (or type in) FROM and your table name (in this case ‘states’, using our states example).
So our finally query is:
SELECT {citqlGEOMCol|ST_AsGeoJSON(geom)} , state_name, sub_region, state_abbr FROM states
Again, as you can see, this is really just a standard PostGIS query:
‘SELECT geom, state_name, sub_region, state_abbr FROM states’ with our citqlGEOMCol tag added.
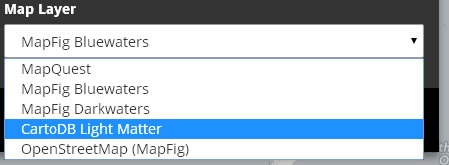
Step 9: Select Base Map
From the drop down at bottom righ of the Query Builder, select the Base Map to use. You can use any map provider you wish to. Adding map base layers and groups is covered in “Adding Map Base Layers and Groups”:
Click the “Save” button.
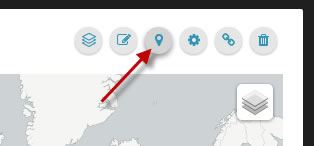
Step 10: Map Options and Content and Styles
At the top right of your new map, click the maker icon show below:
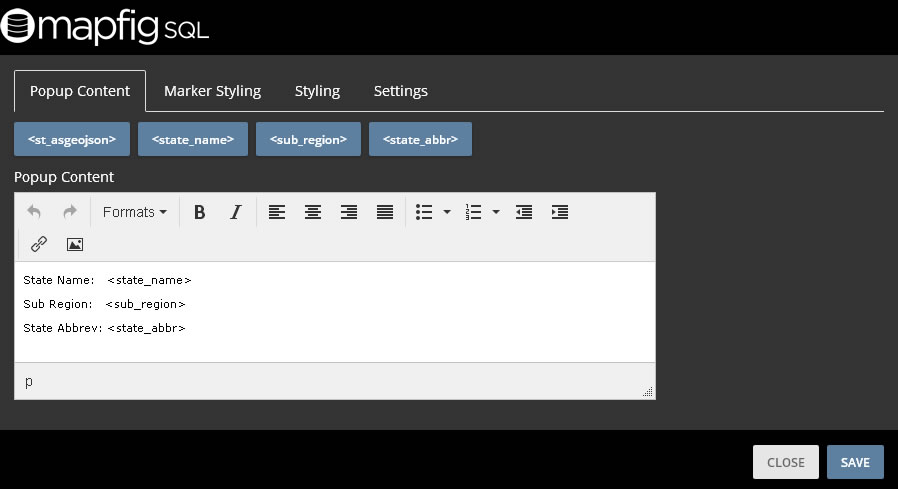
Step 11: Pop-Up Content
In the Popup Content tab, you will see the column names that were included in your query.
Click the column data that you want to include in the pop-up. This is what users will see when clicking on the relevant area of your map.
You can also add links, images, as well as format text.
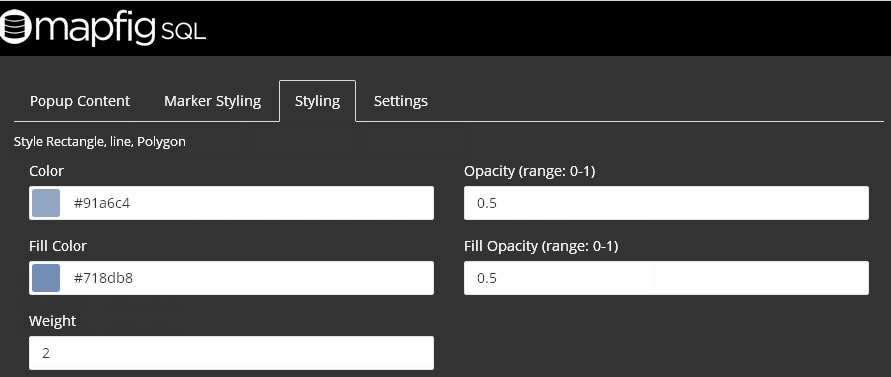
Step 12: Layer Styling
In the Styling tab, you will can style the colour, opacity, and weight of both the fill and border.
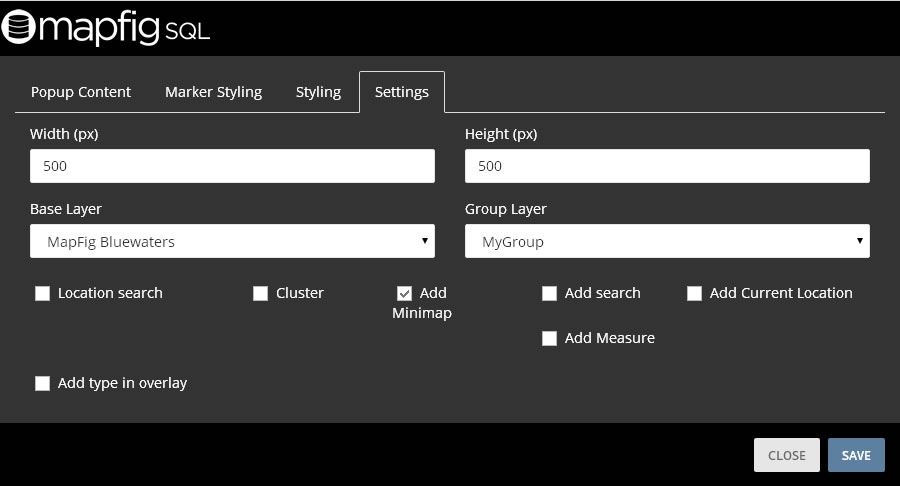
Step 13: Map Settings
In the Settings tab, you set the height, width, as well as add features such as MiniMap, Search, etc..
You can select the Group Layer for the map. This is the base layers that users will be able to view from the layer selector at the top right of your map.
Congratulations! You have created your first PostGIS map!
Adding additional layers to your map can be done via Maps > Map Layers. There, you can create layers from SQL and add them to any map(s).
In subsequent instalments, we will show how to add additional layers to your map, as below.
To see just “First Map” we created above, select “First Map” from the Layer Selector or the Layer Icon at top right.
If you have any question or need assistance, please create a support ticket and we are here to assist!